Dashboards
See the pipeline, revenue, spend and ROAS your mail earned, across all your campaigns.
Overview
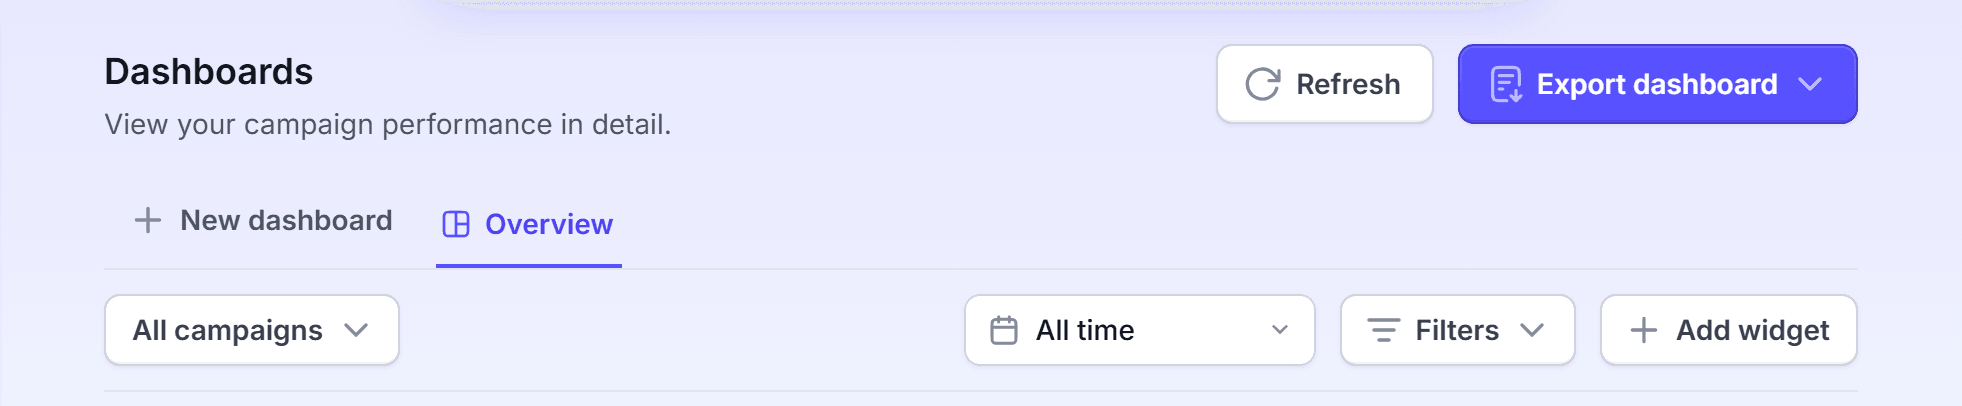
The Dashboards page shows what your mail earned across all your campaigns. The Overview dashboard gives the pipeline, the closed revenue, the spend and the return on ad spend (ROAS).
You can use Dashboards to:
- Read each week which campaigns earn the most.
- Filter the numbers to one period or to some campaigns.
- Build your own dashboard from widgets.
- Export a dashboard to share it.
The dashboard fills in after your first send delivers. To see revenue, connect a CRM, such as ServiceTitan. LettrLabs then matches jobs and invoices to your mail.
Read the Overview
Read the Overview each week to see what your mail earned.
In the left navigation, under Measurement, click Dashboards.
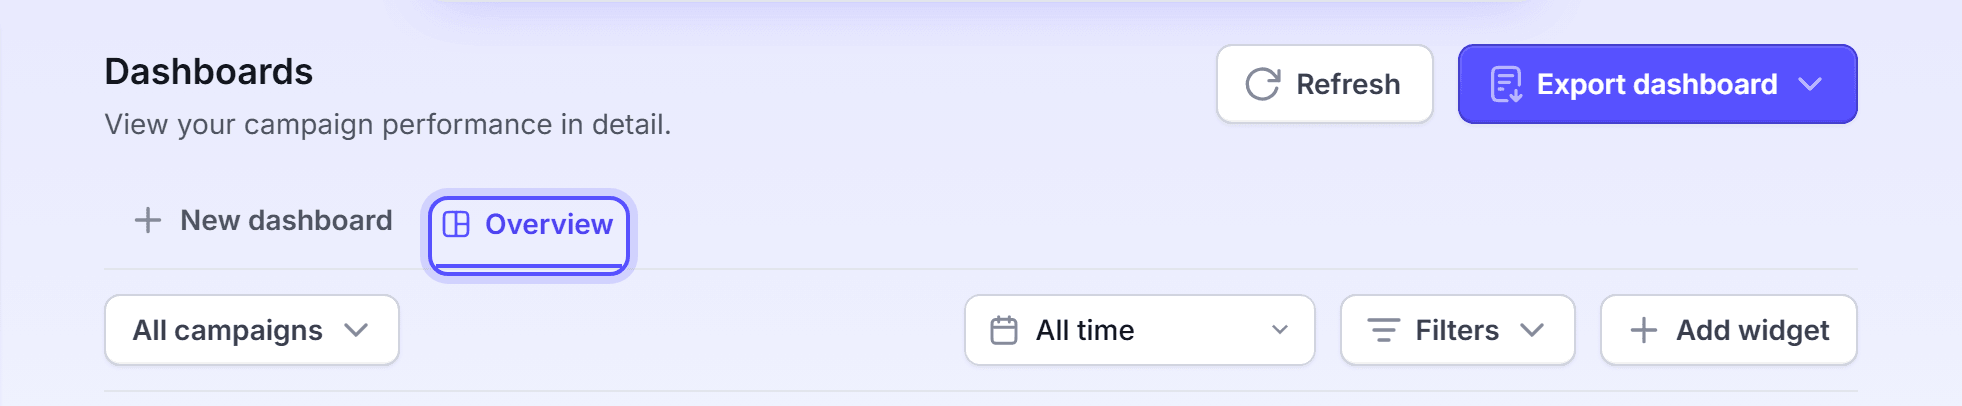
Click the Overview tab, if it is not open.
Read the four figures at the top: Total pipeline, Closed revenue, Spend (delivery date) and ROAS.
Read the charts under the figures.
Click Refresh to load the latest data.
The Overview widgets are in the table below, with what each one shows.
| Widget | What it shows |
|---|---|
| Total pipeline | The value of the opportunities your mail reached |
| Closed revenue | The revenue your mail reached |
| Spend (delivery date) | Your mail spend, by the date the mail delivered |
| ROAS | Closed revenue divided by spend |
| Pipeline | The pipeline by stage |
| Closed revenue by product | The revenue by mail product |
| Top campaigns | Your best campaigns |
| Conversions by state | The conversions on a map of the U.S. |
| ROAS by product | The ROAS of each mail product |
| Spend by postage type | The spend by postage type |
| ROAS and Projected ROAS per campaign | A table with one row per campaign |
You're done when the figures show for the period on the toolbar. Reading a dashboard changes nothing.
Filter a dashboard
Filter a dashboard to see one period, some campaigns or one kind of result.
In the period control, select a period, such as This year or Last 90 days.
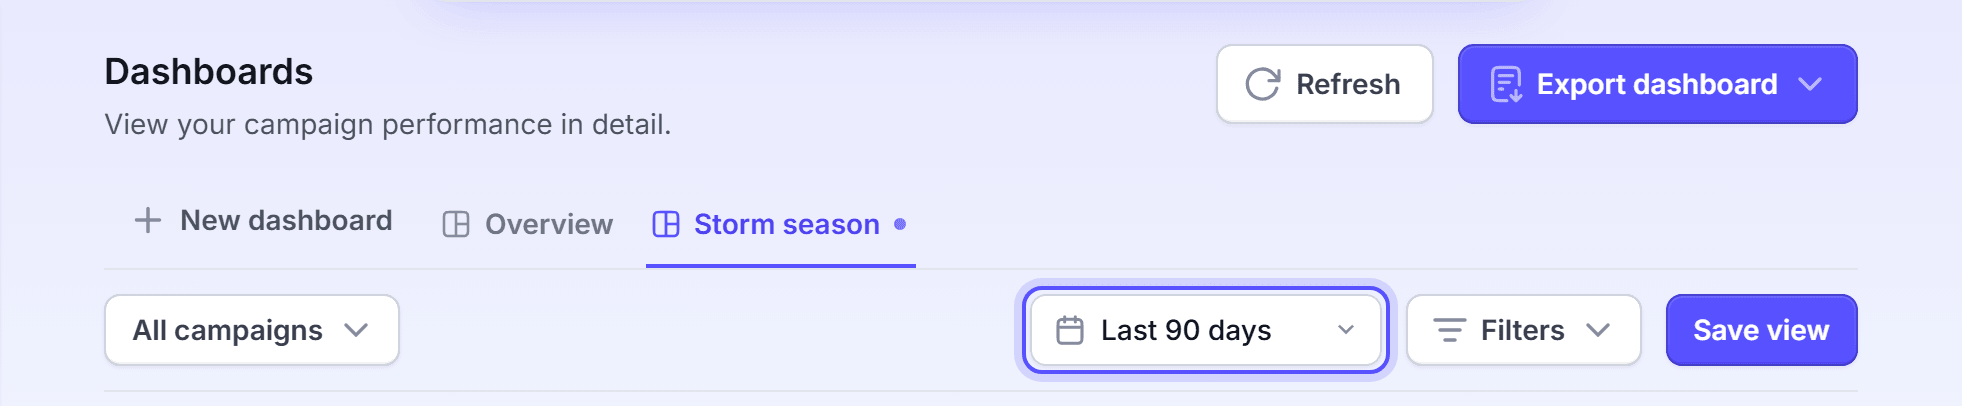
To set your own dates, select Custom range, then pick the start and end dates.
To see some campaigns only, click All campaigns, then select the campaigns.
Select Influenced or Generated.
To filter on another field, click Filters > Add filter. Pick the field and the values.
Click Apply filter.
The other periods are All time, This quarter, This month, Last month and Last 30 days. To remove every filter, click Filters > Clear all.
The Overview is a fixed dashboard, and it does not keep your filters. To keep a set of filters, create your own dashboard. Set the filters on it, then click Save view.
You're done when the figures change to match the filters. The filters change only what you see.
How Influenced and Generated count
The basis on the toolbar decides which records the figures count.
| Basis | What it counts |
|---|---|
| Influenced | Each record that the mail reached. |
| Generated | Only a record whose opportunity started after the mail arrived, inside the attribution window. |
For the full rules, see How attribution works.
Create your own dashboard
Create your own dashboard when the Overview does not show what you need.
On the Dashboards page, click New dashboard. A new tab opens, with its name ready to edit.
Enter a name, then press Enter.
Click Add widget. The widget gallery opens.
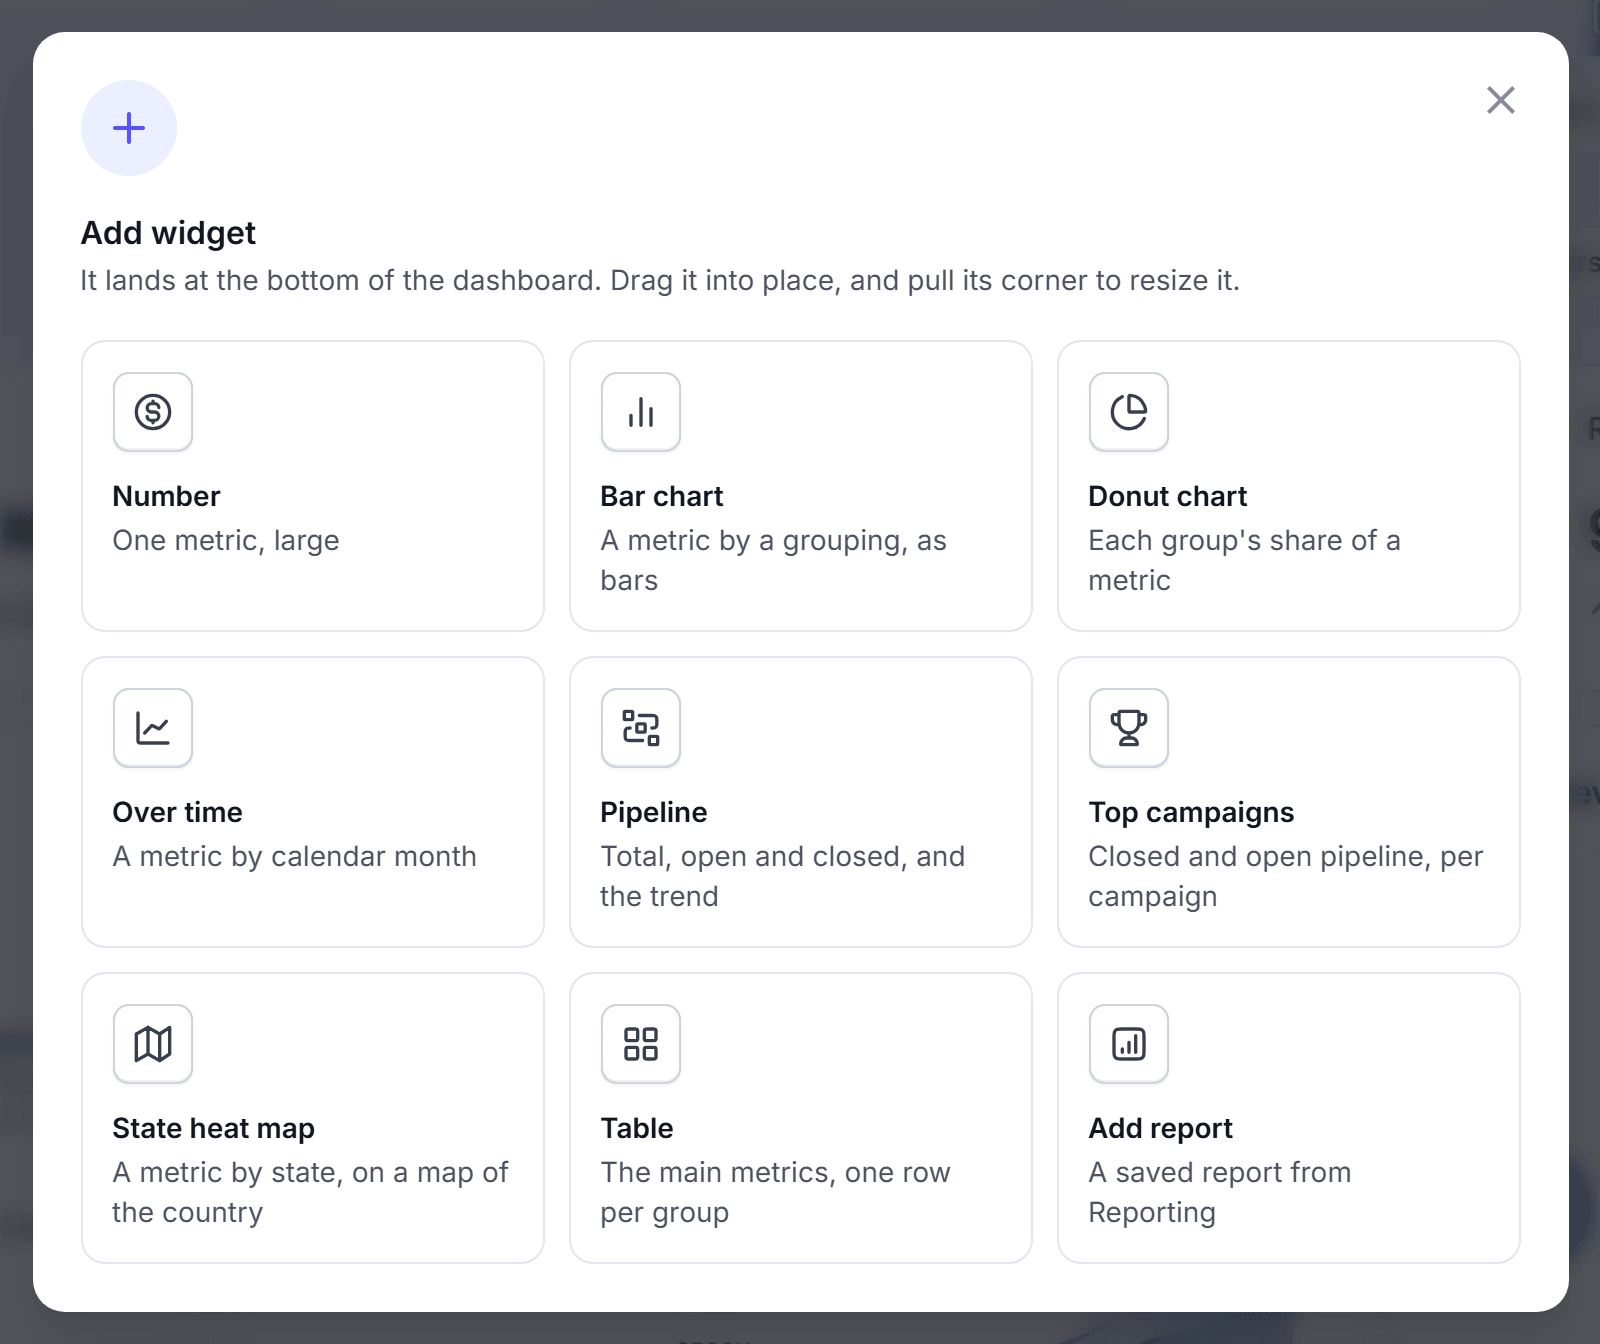
Click a widget type, for example Number or Bar chart.
In Edit widget, set the Title, the Metric and the Group by.
Drag the widget into place, and pull its corner to resize it.
Click Save view.
The widget types are Number, Bar chart, Donut chart, Over time, Pipeline, Lifecycle funnel, Top campaigns, State heat map and Table. To show a saved report from Reporting, click Add widget, then click Add report and pick the report.
To change a widget later, open its menu and click Edit widget, Duplicate or Delete.
You're done when the new tab shows your widgets. Each person in the account sees the dashboard. A dashboard costs nothing.
Rename or delete a dashboard
Rename a dashboard to make its name clear, or delete one that nobody uses.
Right-click the tab of the dashboard. Or select the tab and press Shift+F10.
Click Rename, enter the new name, and press Enter.
To delete the dashboard, click Delete in the same menu. Then click Delete view in the dialog.
The Overview is a fixed dashboard. It has no menu, so you cannot rename or delete it.
You're done when the tab shows the new name, or the tab is gone. A delete removes no numbers. The numbers stay.
Export a dashboard
Export a dashboard to share it with a person who does not use LettrLabs.
Click Export dashboard.
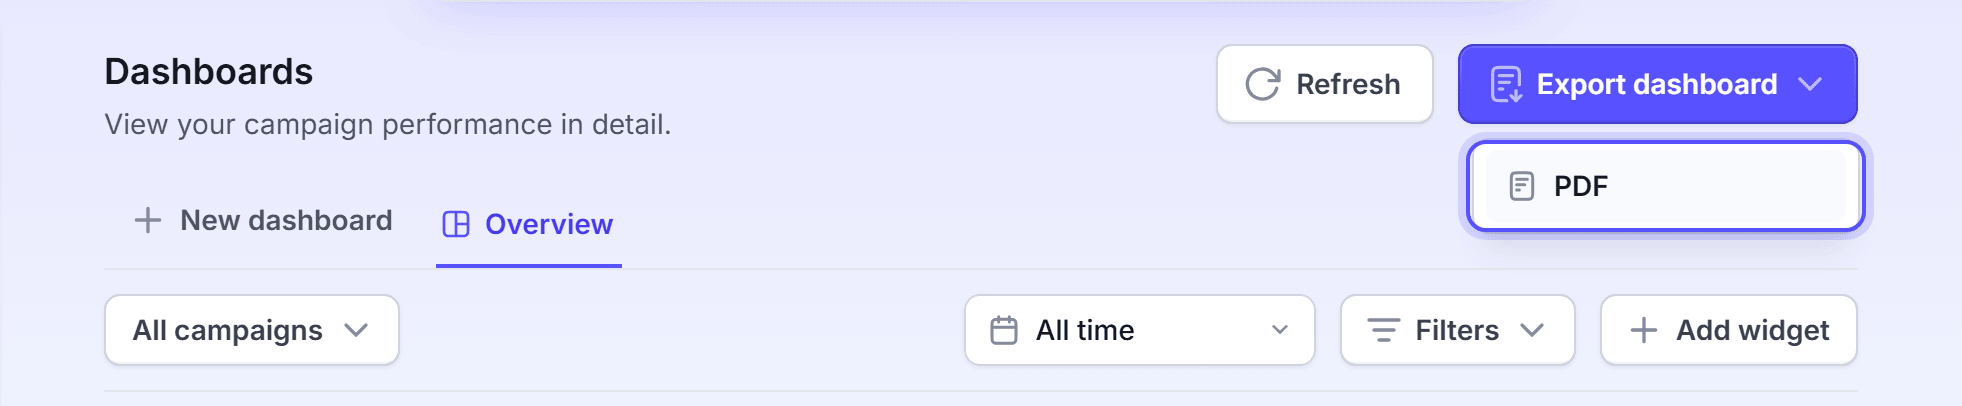
Click PDF. The export dialog opens.
Optional: Change the Report title, and turn Start with a cover page on or off.
Select the dashboards to include. Use the arrows to change their order.
Click Download PDF.
Each dashboard is one section of the PDF, with its own filters and period. A dashboard exports as a PDF only. For a CSV, export a table report from Reporting.
You're done when the file downloads to your computer. LettrLabs makes the export in your browser.
FAQ
Related
How attribution works
Learn how LettrLabs matches revenue to your mail.
Reporting
Build reports with your own columns.
ServiceTitan
Connect ServiceTitan to see your revenue.
Steps checked 2026-11-09.