Reporting
Read and build reports on your campaigns.
Overview
Reporting holds your reports. A report shows any metric by any field, as a chart, a table or a pivot. It goes past the fixed figures of Dashboards.
You can use Reporting to:
- Read the standard reports by month, by campaign and by account.
- Build your own report from the fields of LettrLabs and your sources.
- Click a figure to see the records under it.
- Export a report as a PDF or a CSV file.
Read the standard reports
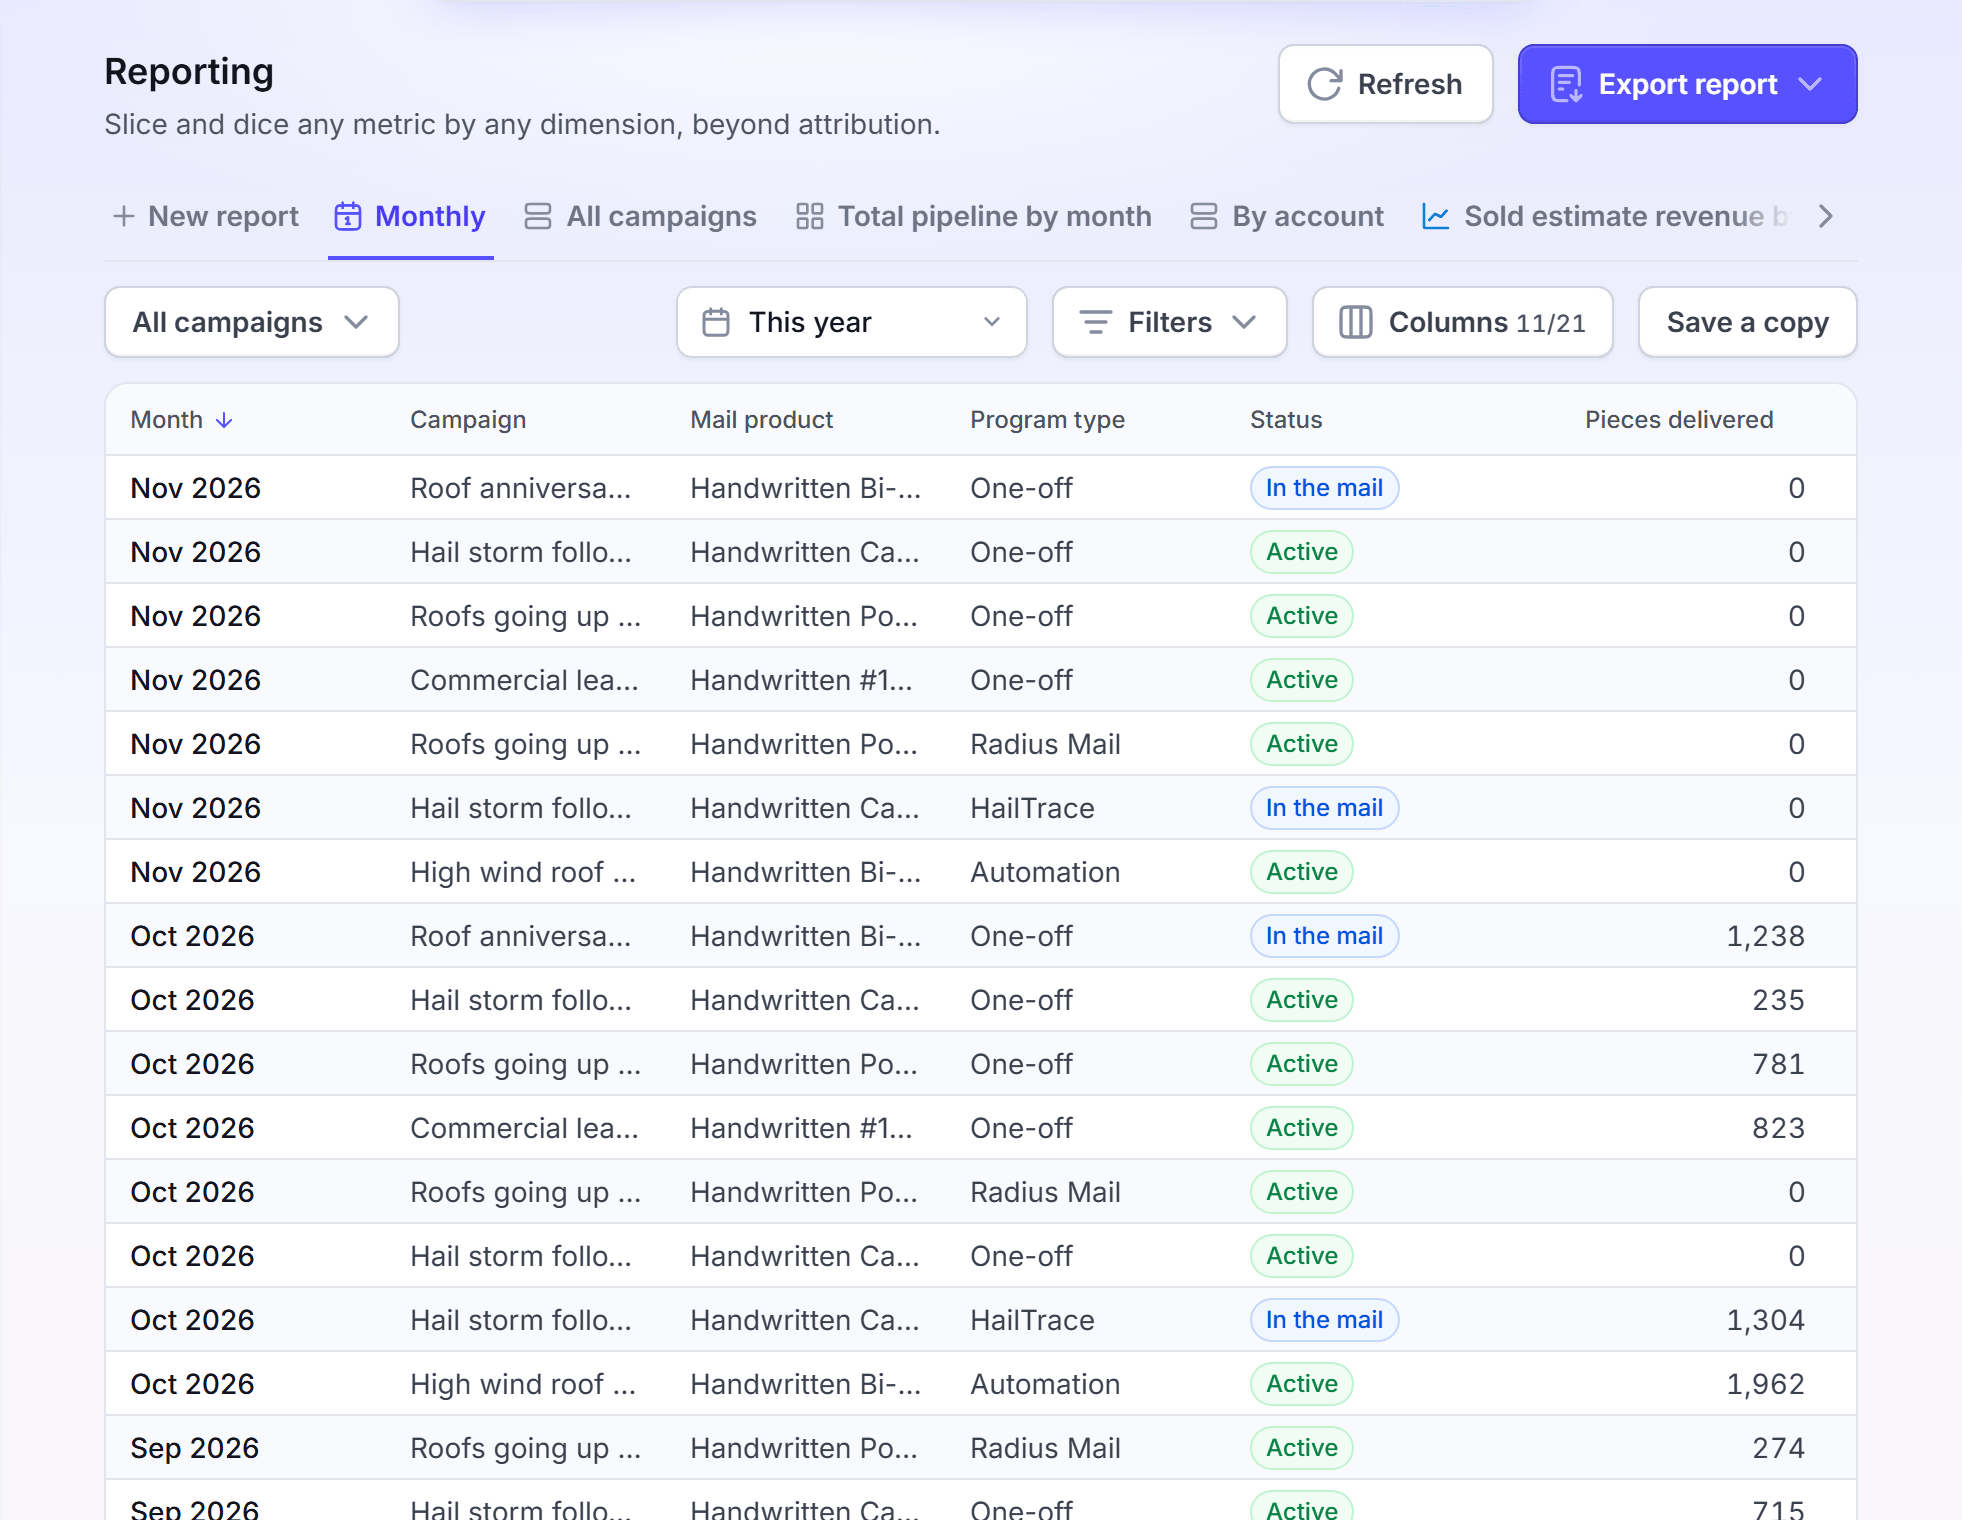
Read the standard reports to see your results by month and by campaign.
In the left navigation, under Measurement, click Reporting. The Monthly report opens.
Click a report tab: Monthly, All campaigns, Total pipeline by month or By account.
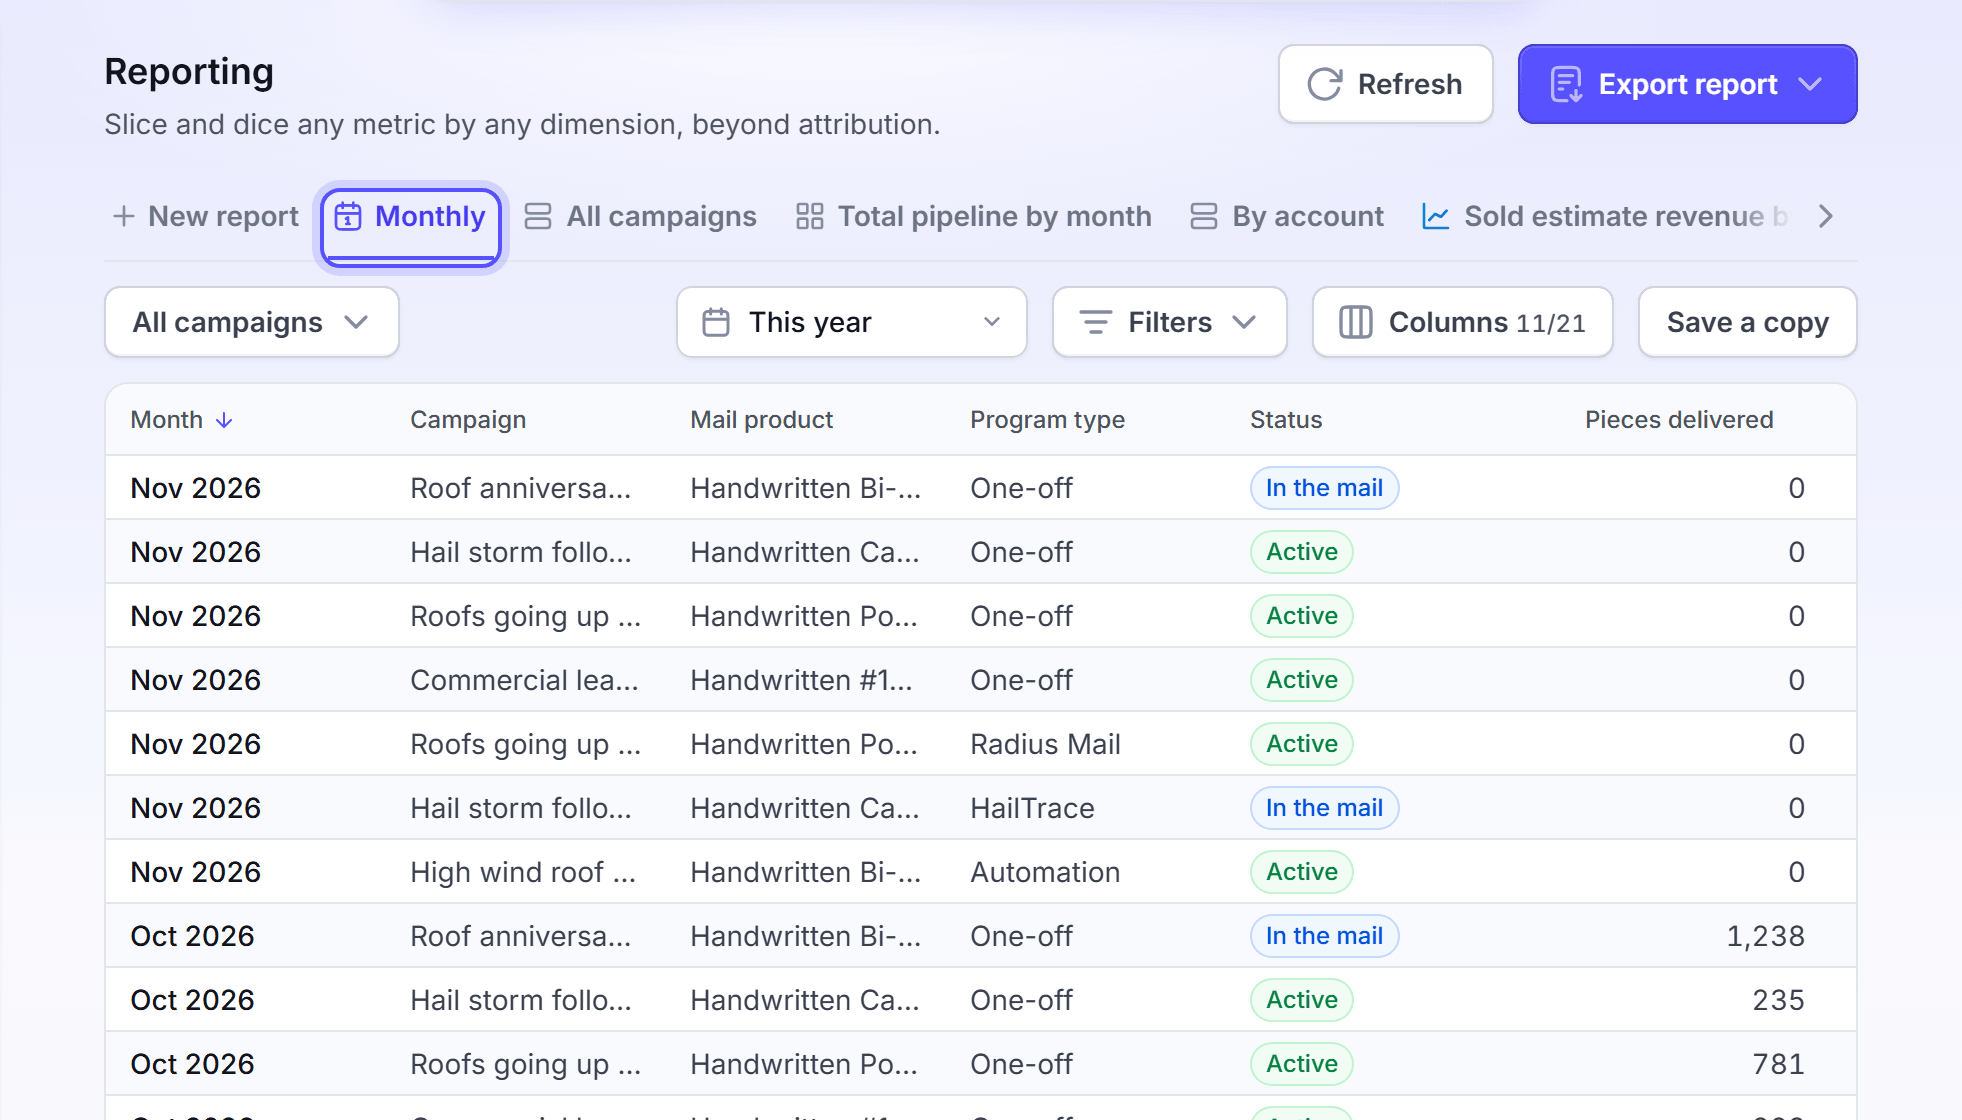
In the period control, select a period, such as This year.
Select Influenced or Generated. For the difference, see How attribution works.
The standard reports are fixed. You cannot rename, change or delete them. To keep a version with your period and filters, click Save a copy. LettrLabs adds the copy as a new tab, with its name ready to edit.
After your own reports, Reporting can show sample reports. A sample report shows when your account has the fields it needs. You cannot change a sample report.
You're done when the report shows the figures for the period you picked.
Build a custom report
Build a custom report when no standard report shows what you need.
Click New report, before the first tab. The report builder opens.
In Enter report name, type a name.
On the Configure tab, under Chart, select a chart type, such as Bar, Line, Table or Pivot table.
In the data sources panel, find a field. Use Search fields to find it fast.
Drag the field into a slot, such as X-axis or Y-axis. Or click the slot and pick the field.
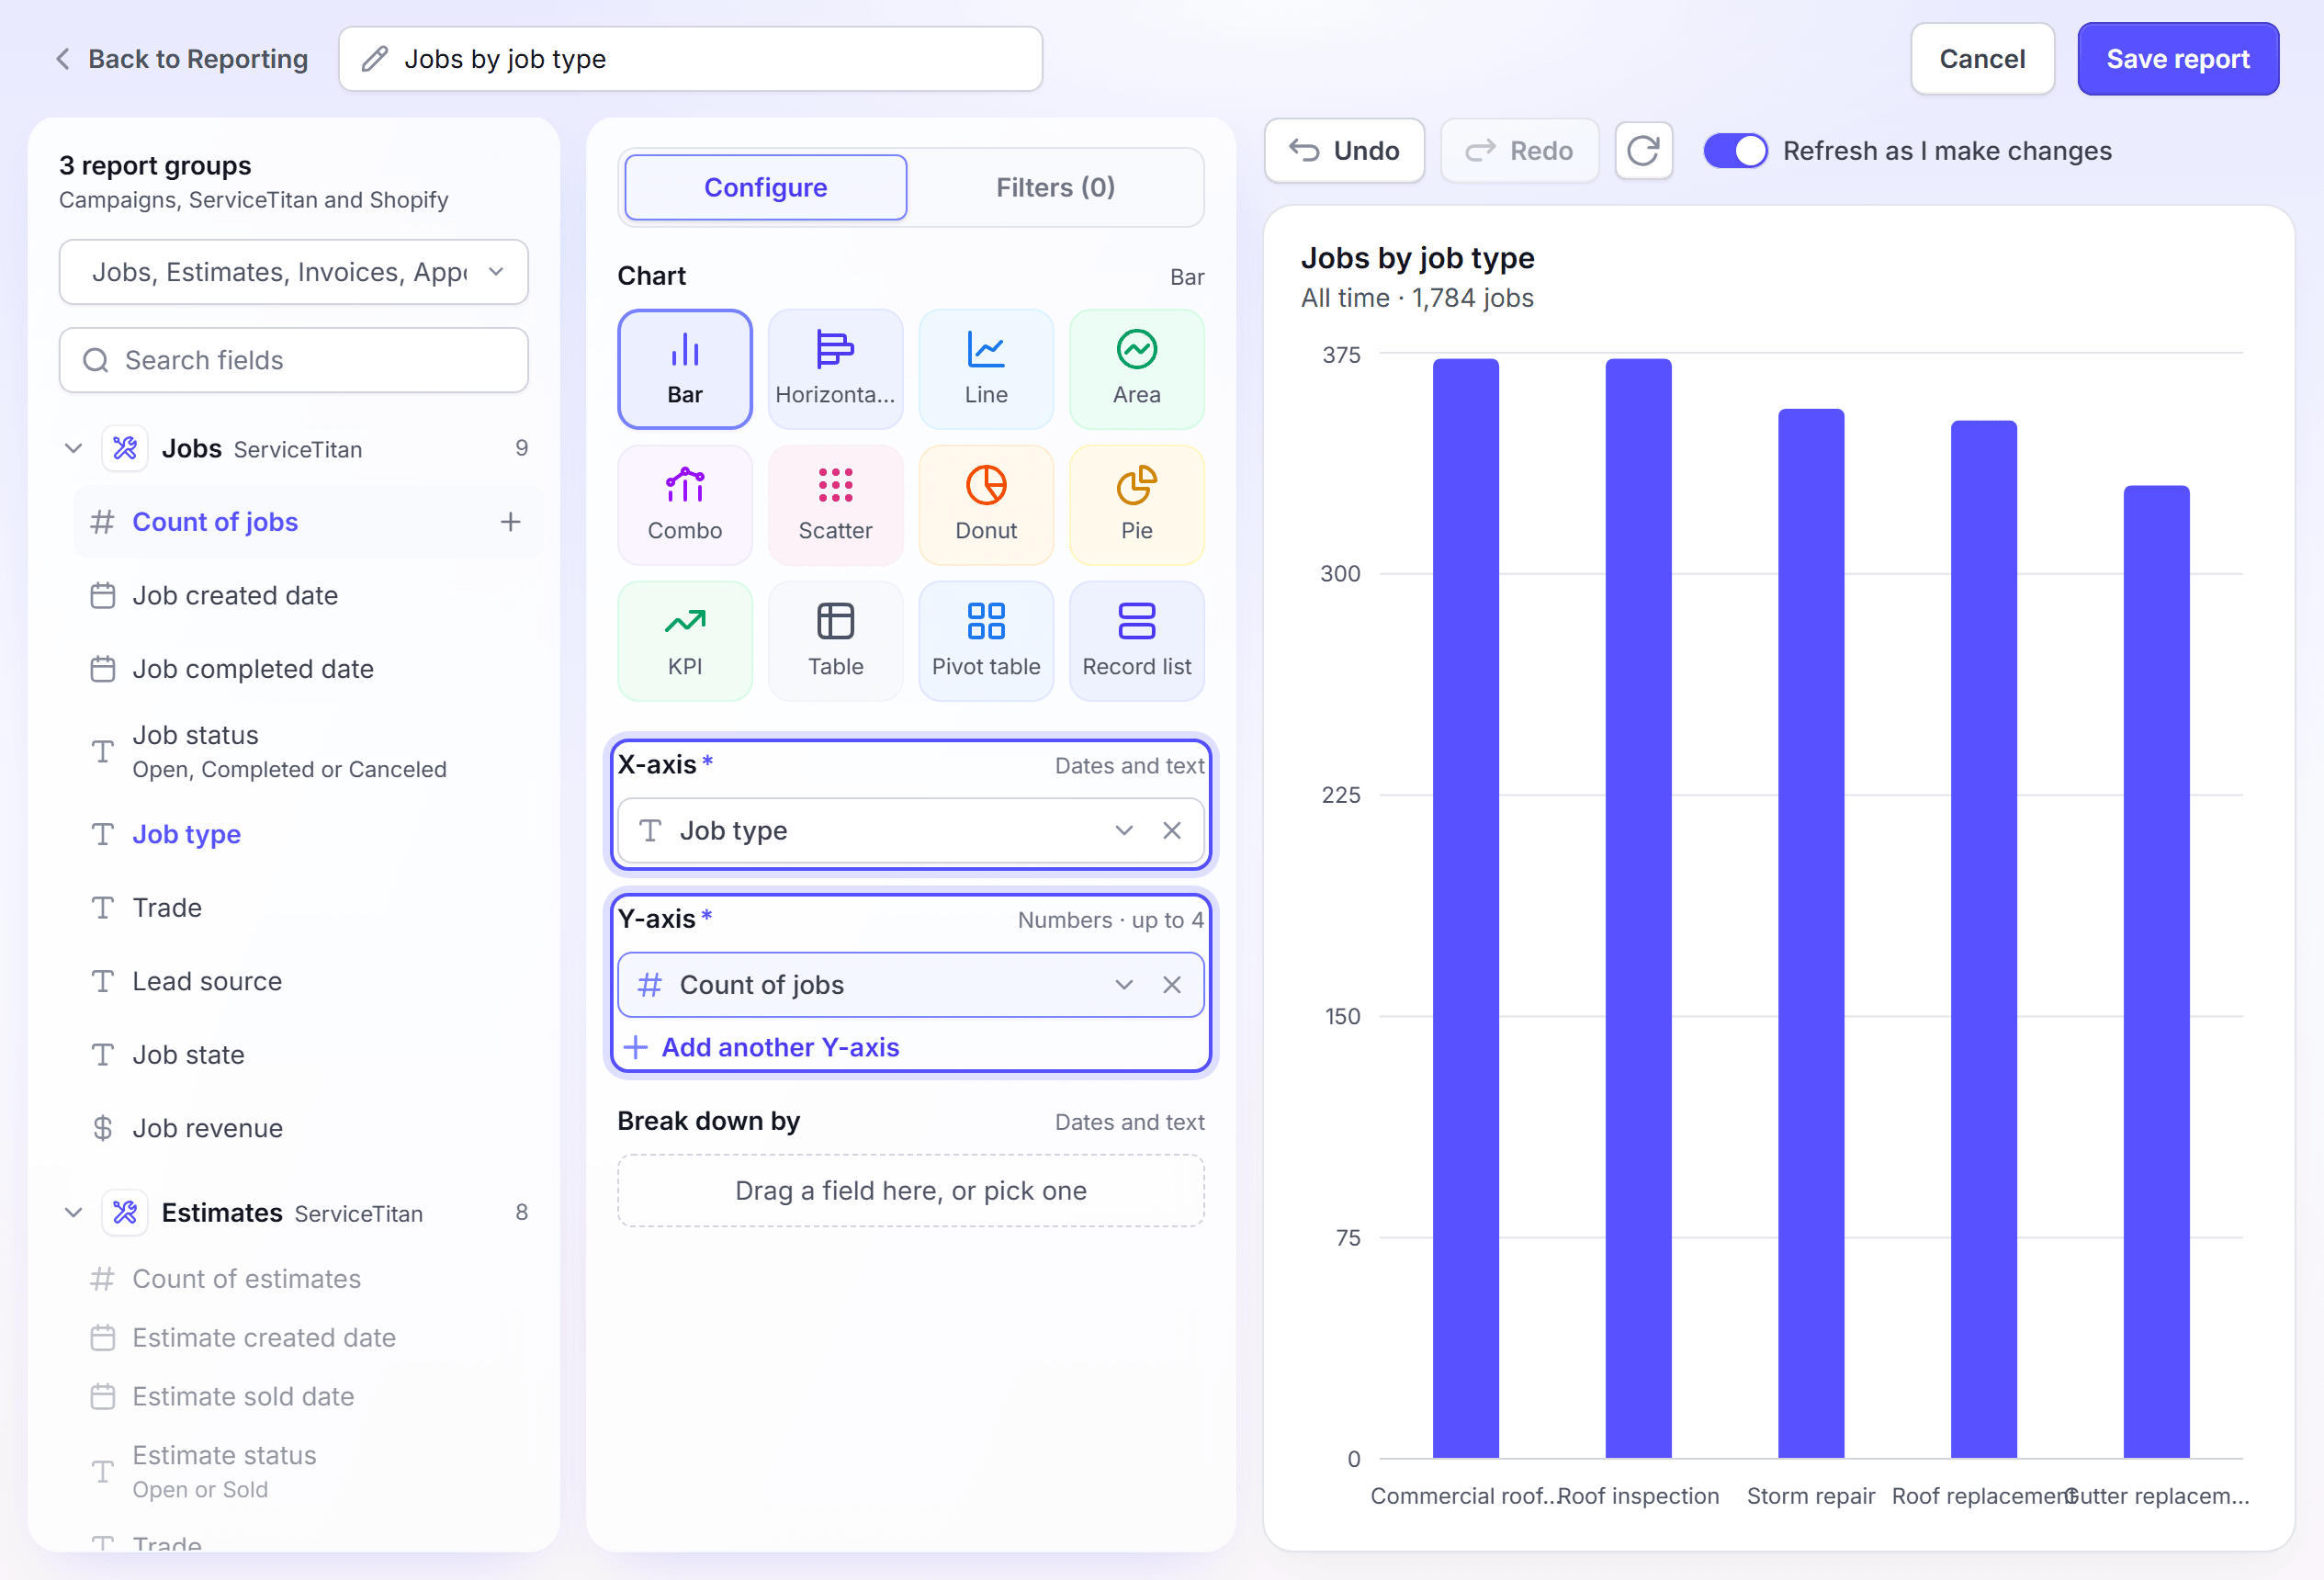
To filter the report, click the Filters tab and add a filter. You can also drag a field onto the tab.
Check the preview. If Refresh as I make changes is off, click the refresh button of the preview.
Click Save report.
You must fill each starred slot before you can save. The builder reads "Fill the starred slots to save." until you do. To undo a change in the builder, click the undo button above the preview.
The chart types are Bar, Horizontal bar, Line, Area, Combo, Scatter, Donut, Pie, KPI, Table, Pivot table and Record list.
You're done when the report shows as a new tab on the Reporting page. Each person in the account sees it. A report costs nothing.
See the records under a figure
Click a figure when you want to see the records that make it.
Open a report.
Click a bar, a slice or a value in the report. A drawer opens.
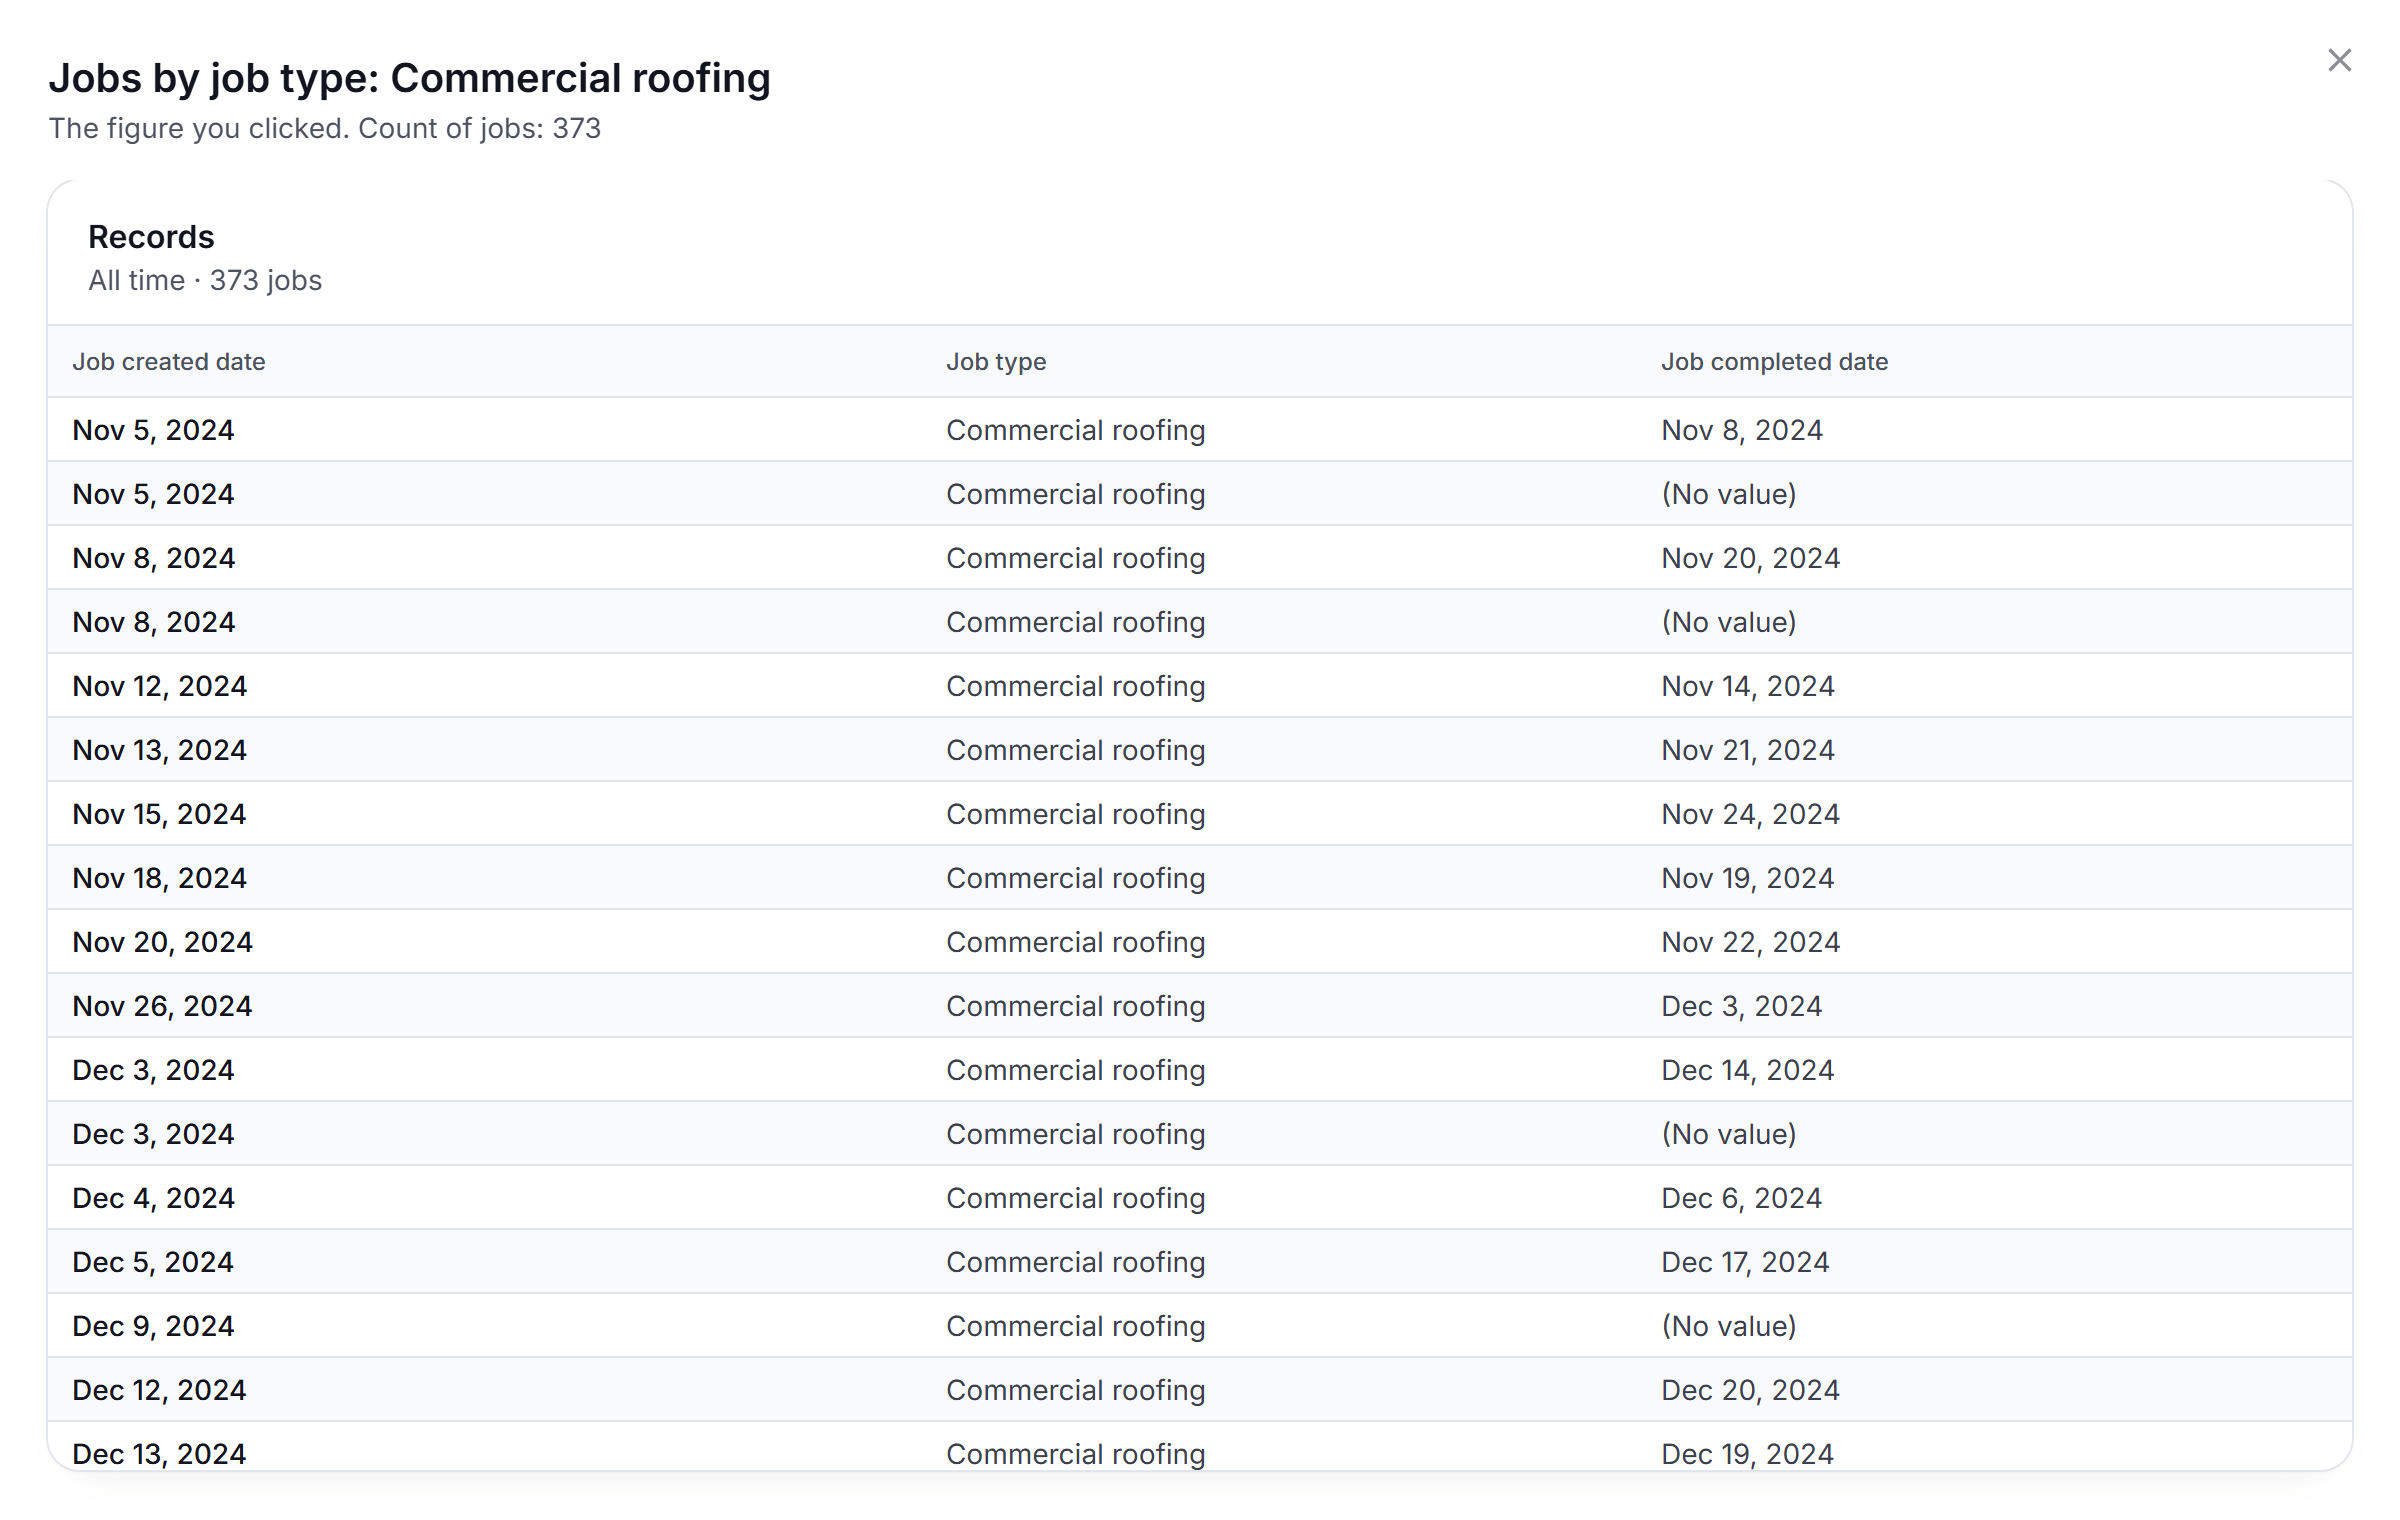
Read the line at the top. It names the figure, for example "Count of jobs: 42".
Read the list of records under it.
You're done when the drawer shows the records. Close the drawer to go back to the report.
Edit, copy, rename or delete a report
Change a report when its question changes, or remove it when nobody uses it.
To edit your own report:
Open the report, then click Edit report. The builder opens on the report.
Make your changes, then click Save changes.
To rename, copy or delete a report:
Right-click the tab of the report. Or select the tab and press Shift+F10.
On your own report, click Rename or Delete. On a standard report, click Save a copy.
To delete, click Delete view in the dialog. To leave the builder without saving, click Cancel, then confirm in the Leave without saving? dialog. The saved report stays.
You're done when the tab shows the new name or the copy, or the tab is gone.
Export a report
Export a report to share it with a person who does not use LettrLabs.
Click Export report.
Click PDF or CSV. The CSV item shows only for a table, a pivot or a monthly report.
For a PDF, the export dialog opens. Set the Report title, and select the reports to include.
Click Download PDF.
You're done when the file downloads to your computer. Each report is one section of the PDF, with its own filters and period.
FAQ
Related
Dashboards
Read the fixed figures of your mail on one page.
How attribution works
Learn what Influenced and Generated count.
Attribution Data
See each record that a report counts.
Steps checked 2026-11-16.